2018 Annual Report
DSC_0541_2000

Photo by David Caress

Visualizing fine details of the deep seafloor

It is estimated that only about five percent of the global seafloor has been mapped in detail, leaving an enormous area yet to be explored. For more than two decades, MBARI engineers have made strides to develop deep-sea mapping capabilities to the point that it is now possible to map objects as small as one centimeter on the seafloor. Thanks to these major advances in seafloor mapping technology, MBARI now has the ability to produce maps that—for the first time—bring together geology and biology. For example, in 2018 MBARI was able to survey a section of Sur Ridge, a steep, biologically-rich seamount 320 kilometers offshore the Big Sur coast of Central California. These new maps allowed Scientist Jim Barry to quantify the remarkable deep-sea sponge and soft-coral communities that call Sur Ridge home.

MBARI’s seafloor mapping program began in 1998, with ship-mounted multibeam bathymetry surveys in Monterey Bay and areas offshore of California, Oregon, and Hawaii. The resulting maps, which provided a broad overview of the shape of the seafloor but with no detail finer than 10 meters, have since served as guiding maps for hundreds of remotely operated vehicle (ROV) dives and other operations by researchers from MBARI and elsewhere. In 2006, MBARI Scientists Charlie Paull and David Clague began collaborating with Principal Engineer David Caress and AUV Group Leader Hans Thomas to use autonomous vehicles optimized for mapping. The sonars on the mapping AUVs collect topography, backscatter intensity to distinguish between hard rock or sediment cover, and subsurface profiles at a resolution of one meter when flown at an altitude of 50 meters above the seafloor. The resulting maps have contributed to advances in our understanding of ­submarine canyons, seamounts, submarine volcanism, fault zones, hydrothermal venting, deep-sea fans, and gas hydrate deposits.

The next challenge for the MBARI Ocean Imaging Project, led by Caress, was the development of a higher resolution mapping capability that could combine one-centimeter-scale topography with color photography while working in areas with complex, steep, or even vertical terrain. This new mapping system is mounted on an ROV, which is then carefully flown at a low altitude, just three meters above the seafloor, to achieve much higher resolutions than systems imaging from further off the bottom. These surveys were envisioned as enabling studies of geological, geochemical, and biological processes that modify the seafloor at fine scales, and also as supporting ecological research through comprehensive mapping of seafloor habitats at the scales of the animals that live there.

Several significant technical and operational milestones for this low-altitude survey system were achieved during 2018, including the integration of a new pair of scanning lasers for light-based topographic mapping, the mounting of the system in an articulating frame that automatically keeps the sensors oriented perpendicular to the seafloor, and successful operations during three seagoing expeditions. The survey system now combines the lasers, multibeam sonar, color stereo still cameras, strobe lights, and an inertial navigation system into a package that is integrated with an ROV. When used to run three-meter-spaced survey lines at a three-meter altitude, this system can map the seafloor topography of a 150-meter-by-150-meter area at one-centimeter lateral resolution in a single 10-hour ROV dive, and simultaneously collect two-millimeter resolution color photography of the same area.

Principal Engineer David Caress explains how the low-altitude survey sled combines instruments to produce images of the deep seafloor.

A lidar is a laser scanner that measures topography by observing the time required for light to travel from the laser to the seafloor, reflect, and return to the sensor. The ability to map large areas at one-centimeter resolution is made possible by a new sensor called the Wide Swath Subsea Lidar, or WiSSL, developed in partnership with 3D at Depth, a small company located in Boulder, Colorado. MBARI began using their prototype subsea lidar for mapping in 2013—the data quality was stunning but the narrow field of view required that survey lines be spaced no more than 1.2 meters apart, and the scan rate did not allow the survey platform to move faster than 0.2 meters/second to achieve full bottom coverage.

Development of the WiSSL began during 2017, with 3D at Depth designing and building a sensor to meet specifications defined by MBARI (with particular input from Thomas and Engineer Eric Martin), including a depth rating of 4,000 meters. The result is the first subsea lidar optimized for efficient swath mapping in the deep ocean.

The WiSSL lasers produce discrete soundings by pulsing 40,000 times each second. Each pulse is directed by a rotating mirror in a pattern that sweeps back and forth across the seafloor about 50 times a second. The lidar has two optical heads, and together these provide a 90-degree-wide field of view, mapping a swath of seafloor about twice as wide as the altitude. In moderately clear water, about 70,000 useful soundings per second are recorded to a maximum range of about 15 meters. This sensor can achieve one hundred percent seafloor coverage with one-centimeter resolution across a six-meter-wide swath while traveling at speeds up to one meter per second.

Auka_mb_and_Pmos5cm_1000x

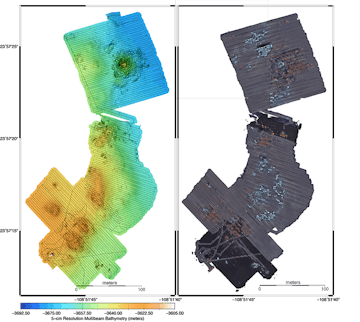
Left, low-altitude survey of Auka Vent Field, in the Gulf of California, showing five-centimeter resolution multibeam bathymetry overlain with the ROV SuBastian tracklines. The survey lines are spaced three meters apart. Right, low-altitude survey of Auka Vent Field showing two-millimeter resolution photomosaic. The parts of the survey collected at a 3.5-meter altitude rather than a 3-meter altitude are darker.
In order to map complex topography, such as the walls of Monterey Canyon, the sides of seamounts, or hydrothermal vent chimneys, the low-altitude survey system must be able to change angles so that it always faces directly towards the seafloor and follows complex terrain. To achieve this, Engineers Martin, Andy Hamilton, and Larry Bird designed an articulating mount for the sensor package within an ROV Ventana toolsled that is able to rotate from pointing the sensors vertically down to horizontally forward. The articulation is automated using data from navigational sonar, allowing the ROV to follow predefined survey lines covering flat to vertical terrain.

Perspective views of lidar (one-centimeter resolution) and multibeam sonar (five-centimeter resolution) topography from the example low-altitude survey. The lidar data reveal the distribution of deep-sea corals while the multibeam shows only the seafloor—optical mapping images animals that are invisible to acoustic systems.

Following the lidar delivery and initial testing in early 2018, the new low-altitude survey system was used on ROV Ventana during two R/V Rachel Carson expeditions. The first large survey targets were a methane gas seep mound at 800 meters depth in Santa Monica Basin and the trace of the active San Diego Trough Fault, both offshore Southern California. These surveys were conducted in conjunction with Scientist Paull’s geologic research. The second series of surveys was at Sur Ridge, a biologically rich feature offshore the Big Sur coast of Central California, where Scientist Jim Barry is conducting research on deep-sea sponge and soft coral communities. The Sur Ridge survey examples shown here demonstrate both the new capability to map steep and complex seafloor and the usefulness for benthic ecology research of simultaneously mapping topography with optical sensors like the WiSSL and acoustic sensors and the 400 kHz multibeam sonar. As shown at right, the lidar maps show topography, including soft animals, while the multibeam signal passes through soft animals and maps the seafloor beneath them (albeit at a lesser, five-centimeter resolution). Consequently, the difference between the WiSSL topography and the multibeam topography generates a map that shows the location and size of the animals.

Sur RIdge Corals Example

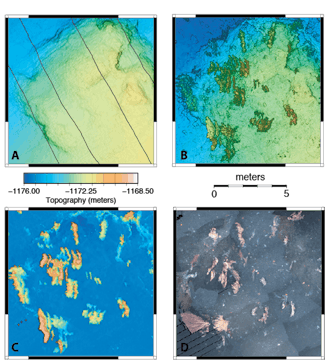
Ten-meter-by-ten meter section of the coral community survey shown above. A) ROV track lines overlain on multibeam bathymetry (five-centimeter resolution). B) Lidar bathymetry (one-centimeter resolution). C) Difference between lidar and multibeam bathymetry, revealing soft animals detected by the lidar but not the multibeam (five-centimeter resolution). D) Photomosaic of uncorrected images at two-millimeter resolution.
The low-altitude survey system was also integrated in a purely down-looking configuration onto the Schmidt Ocean Institute’s ROV SuBastian and used to survey a hydrothermal vent field in the South Pescadero Basin in the Gulf of California, during an R/V Falkor expedition. This vent field was originally discovered with MBARI’s AUV mapping system in 2015. Returning to the same site with the low-altitude survey system, allowed a team of engineers, geoscientists, chemists, and biologists to work together to explore some of the planet's deepest known hydrothermal vents.

ROV SuBastian using a manipulator to take a sediment push core in a bacterial mat. The biological exploration and sampling of the Auka Vents in the Gulf of California were guided using the context provided by the low-altitude survey bathymetry and photomosaic.

The biologists in the team—MBARI Adjuncts Victoria Orphan of the California Institute of Technology and Shana Goffredi of Occidental College—are seeking a more accurate understanding of the influence that underlying chemical and geological factors exert on the bacteria and animals that live at hydrothermal vents. The high-resolution mapping data provided a unique opportunity for them to fully understand the spatial extent of these chemosynthetic communities and link the broad-scale features with more localized ecological and chemical data. Guided by these new high-resolution image mosaics, Orphan and Goffredi were able to strategically sample bacteria and animals and combine those collections with in situ temperature measurements and lab-based chemical assessments.

Whether at one meter or one centimeter scale, the seafloor mapping team has focused on developing capabilities to quantitatively measure change on the seafloor through repeated surveys and ensuring that mapping missions are useful and efficient. MBARI’s long-term investment in the seafloor mapping program exemplifies David Packard’s vision of what is possible when scientists and engineers work together to develop new sensors and systems for exploring the deep sea. The mapping program has reaped significant rewards in studies of varied seafloor environments and diverse lines of inquiry, oftentimes leading to outcomes that could never have been anticipated. We look forward to the discoveries that lie ahead as we continue our work to visualize the ocean’s interior and seafloor where new mysteries undoubtedly await.

FK181031_Experts And Lidar_20181108_Naranjo_1080

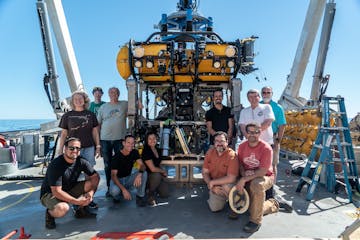
Science team on the Falkor cruise. Standing from left, Jennifer Paduan, Erik Trauschke, Robert Zierenberg, Giancarlo Troni, David Clague, and David Caress. Kneeling from left, Nestor Ramirez-Zerpa, Ronald Spelz, Emery Nolasco, Eric Martin, and Hans Thomas. Photo by Monika Naranjo Gonzalez / photo courtesy of Schmidt Ocean Institute.
Tagging along with sharks to a mysterious deep-ocean gathering spot

MBARI engineers develop camera tag system for Monterey Bay Aquarium research on shark behavior.