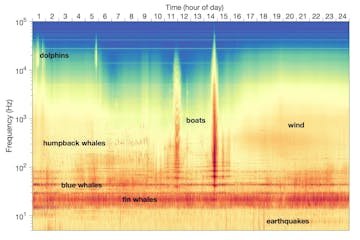
Example of a spectrogram from a single day of MARS recordings (1 November 2016) with time across the horizontal axis and frequency range of 5 to 100,000 Hz on the vertical axis. This is far greater than the range of human hearing (about 20 to 20,000 Hz). The intensity of sound is represented by color, with warmer colors indicating higher intensity. In this one day of the Monterey Bay soundscape, whales, dolphins, earth processes (wind and earthquakes), and human activities (boats) were recorded.

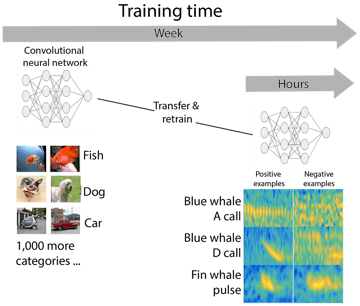
Building on a neural network that was trained using many and diverse images, transfer learning adds network layers to enable classification of images representing whale vocalizations.

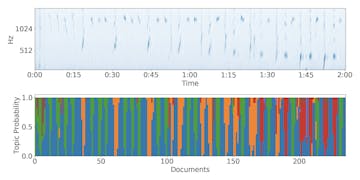
Sample topic model output shows the ability to detect humpback song units. Above, the spectrogram from a short segment of humpback song; dark blue features represent individual song units. Below, the topic model output shows how it was able to distinguish different types of song units (represented by different colors; blue corresponds with the quiet background in the spectrogram above where song is absent).
